Does Solar Actually Pay Off? A Homeowner's Honest Math
Solar salespeople promise savings. Skeptics say it's a scam. The truth depends on four numbers specific to your house. Here's how to run them yourself.
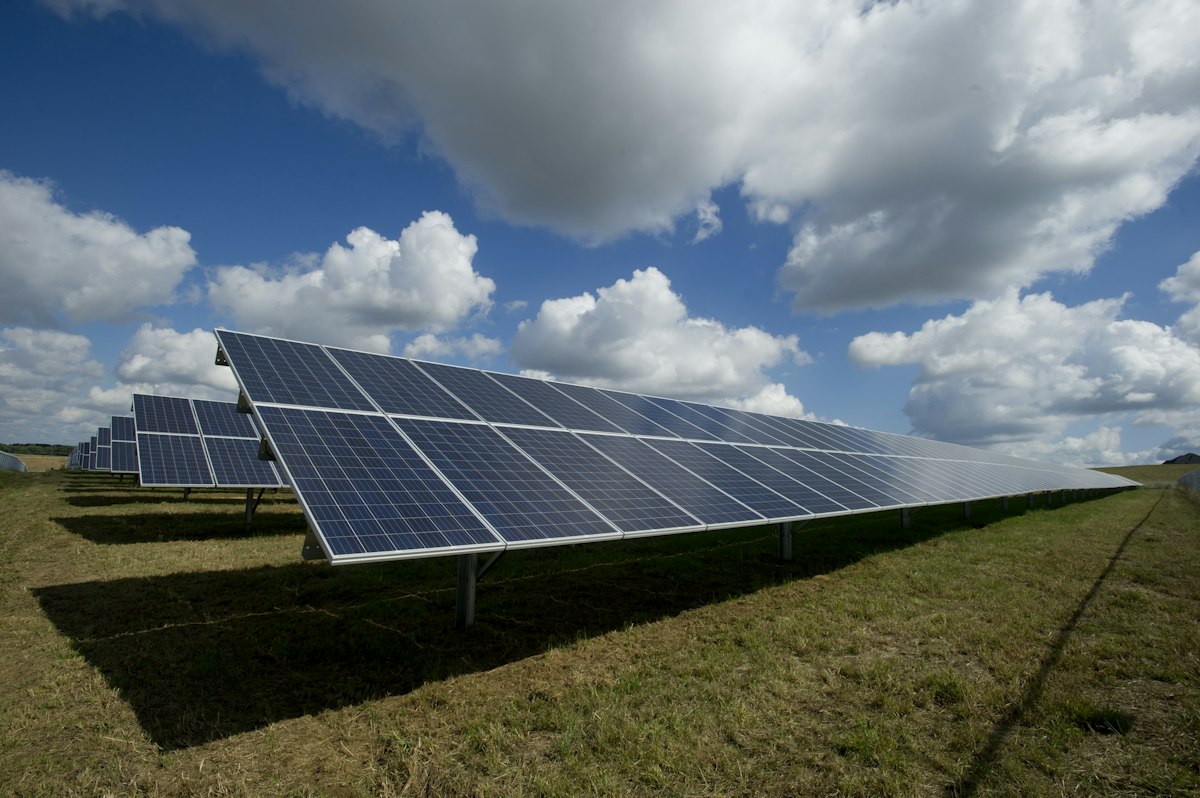
Rooftop solar has gone from novelty to mainstream in a decade. It’s also become one of the most aggressively sold home products in America, which means most homeowners hear about it first from a salesperson with a quota rather than from a neutral source.
Here’s the neutral version. Solar pays off for some homes and doesn’t for others, and the difference comes down to four numbers you can find yourself.
Number 1: What You Pay Per Kilowatt-Hour
Pull up your last 12 months of electric bills and find your total cost divided by total kWh used. Include all the delivery charges and fees, not just the ‘generation’ rate — you’re trying to find what a kWh actually costs you.
- Under 12 cents/kWh: Solar payback is slow. You’re saving pennies per kWh, so it takes many years to recover the system cost.
- 12–18 cents/kWh: The middle. Solar can work if the other three numbers are favorable.
- Over 18 cents/kWh: Strong candidate. California, New England, Hawaii, and parts of the Mid-Atlantic live here.
Rates also trend upward over time, which improves solar’s case — but base your decision on today’s rate, not projected increases a salesperson chose.
Number 2: Your Roof’s Sun Exposure
Solar production depends on orientation, pitch, and shade.
- South-facing, 20–40 degree pitch, no shade: Ideal. Expect 100% of rated production.
- East or west-facing: Roughly 80–85% of ideal.
- North-facing: Usually not worth it in the continental U.S.
- Shade from trees or buildings for more than an hour or two mid-day: Significant production loss. Panel-level optimizers help but don’t eliminate it.
Free tools like Google’s Project Sunroof estimate your roof’s production potential from satellite imagery. Use it before you take a sales call.
Also: how old is your roof? If it needs replacement within 5–8 years, do that first. Removing and reinstalling panels later costs $2,000–$5,000.
Number 3: Your State’s Net Metering Policy
This is the number salespeople least want to discuss and the one that matters most.
Solar produces the most power at midday, when most people aren’t home using it. Net metering determines what you get for the excess you send to the grid.
- Full retail net metering (1:1): Every kWh you export is credited at the same rate you’d pay to buy one. This is the best case, and it’s becoming rarer.
- Net billing / avoided-cost credit: Exports are credited at the wholesale rate, often 3–6 cents/kWh, while you still pay retail to buy. Payback lengthens significantly. California’s NEM 3.0 moved to this model in 2023, and many states are following.
- No net metering: Excess is essentially given away. Without a battery, solar only makes sense if you can use most of what you produce in real time.
Check your specific utility’s current policy and whether it’s grandfathered for a fixed term. Policies change, and you want to know your exposure.
Number 4: Your Real Installed Cost After Incentives
National average installed cost is roughly $2.50–$3.50 per watt before incentives. A typical 7 kW residential system runs $17,000–$25,000.
Incentives that reduce that:
- Federal Investment Tax Credit: 30% of system cost as a credit against federal taxes owed (through 2032 under current law). You need enough tax liability to use it.
- State and utility rebates: Vary widely. Some states offer nothing; others have meaningful programs.
- SRECs: In a handful of states, you can sell renewable energy certificates for additional income.
Get three quotes. Pricing varies 20–30% between installers for identical equipment.
Running the Payback
Simple version:
Annual savings = (kWh produced * your rate) adjusted for net metering policy Net cost = Installed cost - incentives Payback years = Net cost ÷ Annual savings
Example, favorable case:
- 7 kW system produces ~9,500 kWh/year
- Rate: 20 cents, full net metering → $1,900/year saved
- Net cost after 30% credit: $15,400
- Payback: ~8 years. Panels warrantied 25 years → 17 years of essentially free power.
Example, unfavorable case:
- Same system, 11 cents/kWh, net billing at 4 cents for the 40% you export
- Annual savings: ~$780
- Payback: ~20 years. That’s most of the warranty period just breaking even.
Same panels. Same roof. Completely different answer.
Buy, Lease, or PPA?
Buying (cash or loan): You get the tax credit and all the savings. Adds to home value. Best long-term outcome if you’ll stay 8+ years.
Lease: No money down, fixed monthly payment. The lease company keeps the tax credit. Savings are modest and the contract must be transferred or bought out if you sell — a known friction point in home sales.
Power Purchase Agreement (PPA): You pay per kWh produced at a rate below your utility’s. Same ownership and transfer issues as a lease. Watch for annual escalator clauses of 2–3% that can erase savings over time.
If you can’t buy, a lease or PPA can still reduce your bill — just understand that most of the value goes to the third party.
The Honest Summary
Solar is a good investment when rates are high, the roof is right, net metering is fair, and you plan to stay. It’s a mediocre one when any of those is off, and a poor one when two or more are. Run your own four numbers before anyone runs them for you.